Lesson 1.1: Planning and Identifying Key Components of a Graph
0% Complete
0/0 Steps
Quiz 1 of 0
Lesson 1.1: Planning and Identifying Key Components of a Graph
Bài tập phân tích 3:
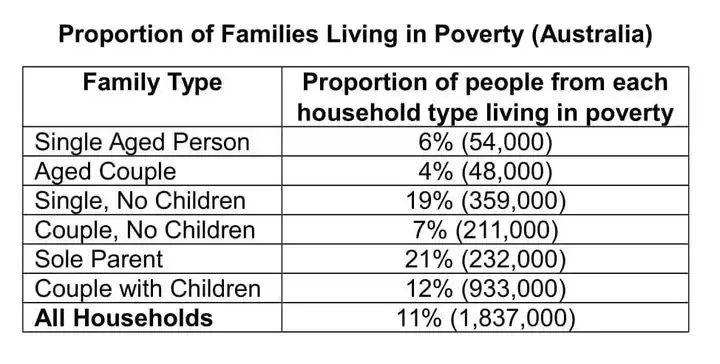
The following table compares the proportion of people from each household type living in poverty in Australia in 1999. Summarise the information by selecting and reporting the main features, and make comparisons where relevant.