
![[Table] Chinh phục writing task 1 - tables cùng JL IELTS Academy:](https://practice-ieltslogic.com/wp-content/plugins/content-views-query-and-display-post-page/public/assets/images/default_image.png)
[Table] Chinh phục writing task 1 – tables cùng JL IELTS Academy:
Chinh phục writing task 1 - dạng Table cùng JL IELTS Academy: Có thể nói table là một trong những ...
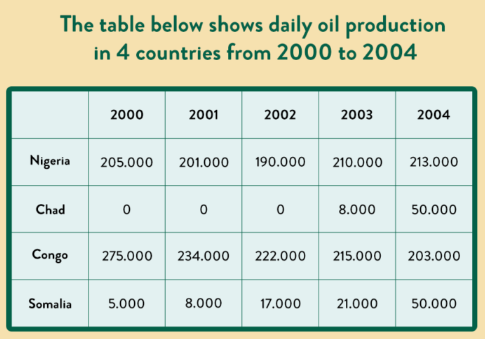
[Table] The table below shows daily oil production in 4 countries from 2000 to 2004
The table below shows daily oil production in 4 countries from 2000 to 2004 The table below provides information about ...
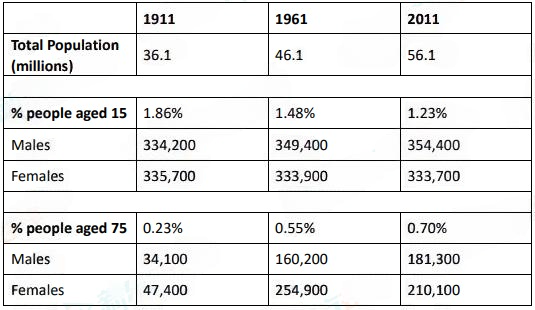
[Table] The table below shows information about UK population between 1911 and 2011
The table below shows information about UK population between 1911 and 2011 The provided table illustrates how the UK population ...
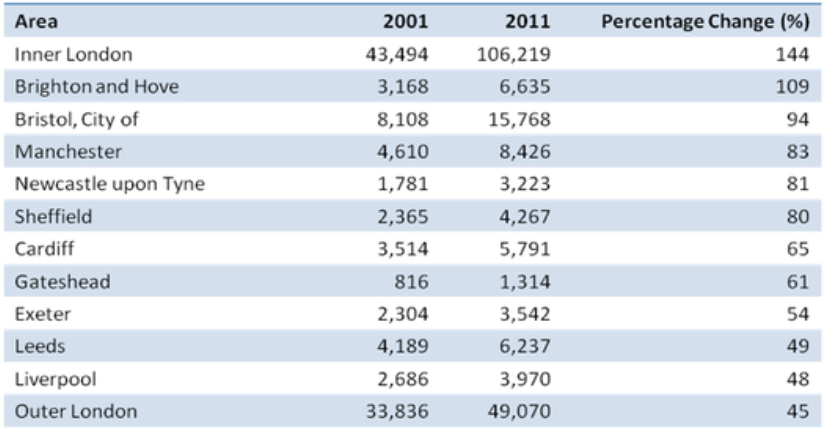
[Table] – Cycling table
The table below shows changes in the numbers of residents cycling to work in different areas of the UK between ...
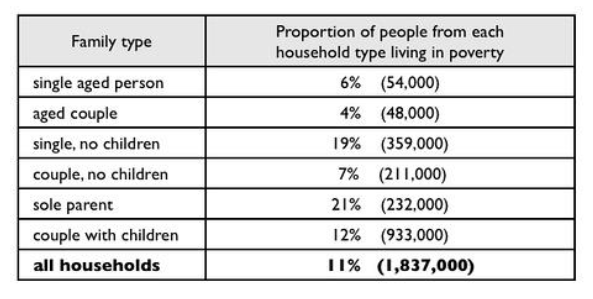
[Table] – Poverty in Australia
The table below shows the proportion of different categories of families living in poverty in Australia in 1999. Plan: Bài ...
[Table] – Waste Production Table
The table below shows the amount of waste production (in millions of tonnes) in six different countries over a twenty-year ...
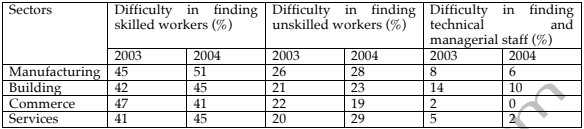
[Table] – Difficulty hiring table (07/08/23)
The table below shows the percentage of employers in various sectors having difficulty in finding staff in 2003 and 2004 ...
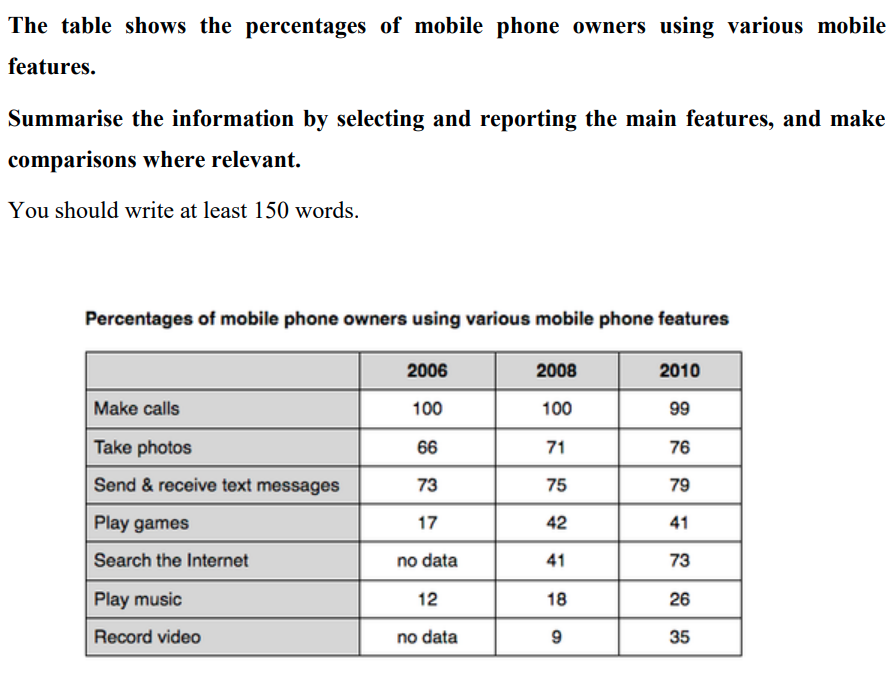
[Table] – Mobile phone feature usage
Planning: Có 2 cách để viết bài này: Cách 1: Viết theo thời gian - về cơ bản mình sẽ ...
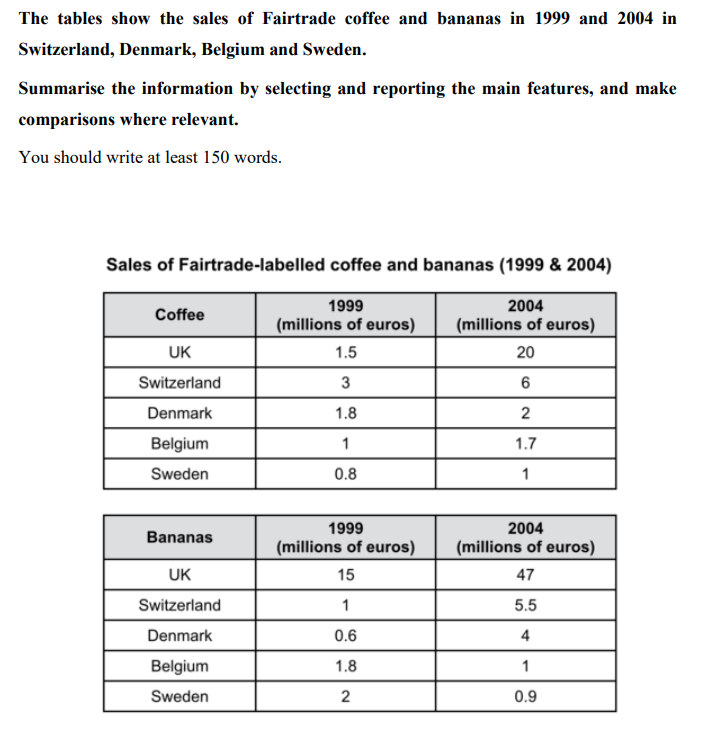
[Table] – Fairtrade coffee and bananas (21/11/23)
The table compares how much money 5 European countries spent on two Fairtrade goods. Overall, sales of Fairtrade products generally ...
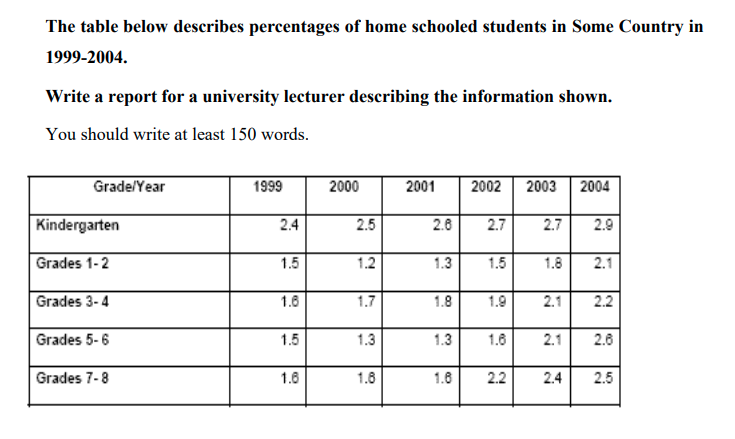
[Table] – Home schooled students
Initially, the figures for homeschooling among grades 1-2 and grades 5-6 witnessed a drop before bouncing back and increasing significantly ...
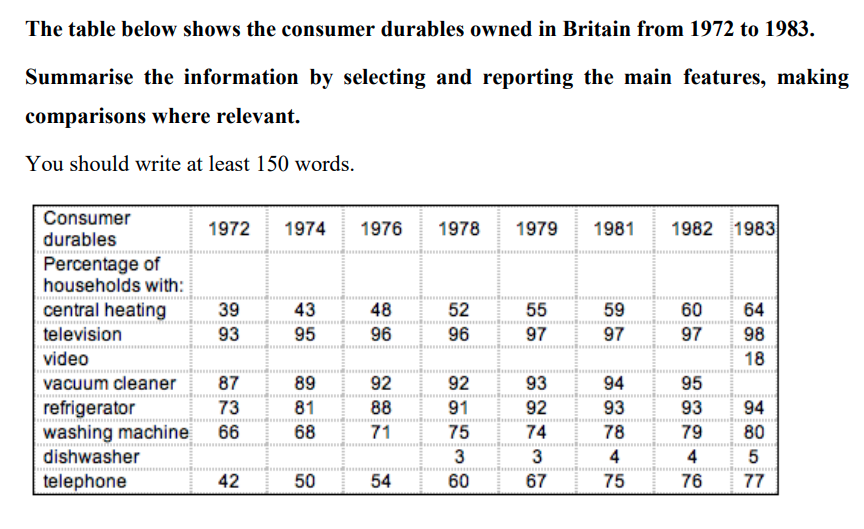
[Table] – Ownership of Durables (23/11/23)
Overview: Overview: Trong tất cả các năm thì số gia đình sở hữu TV là cao nhất. Ngoài ra thì ...
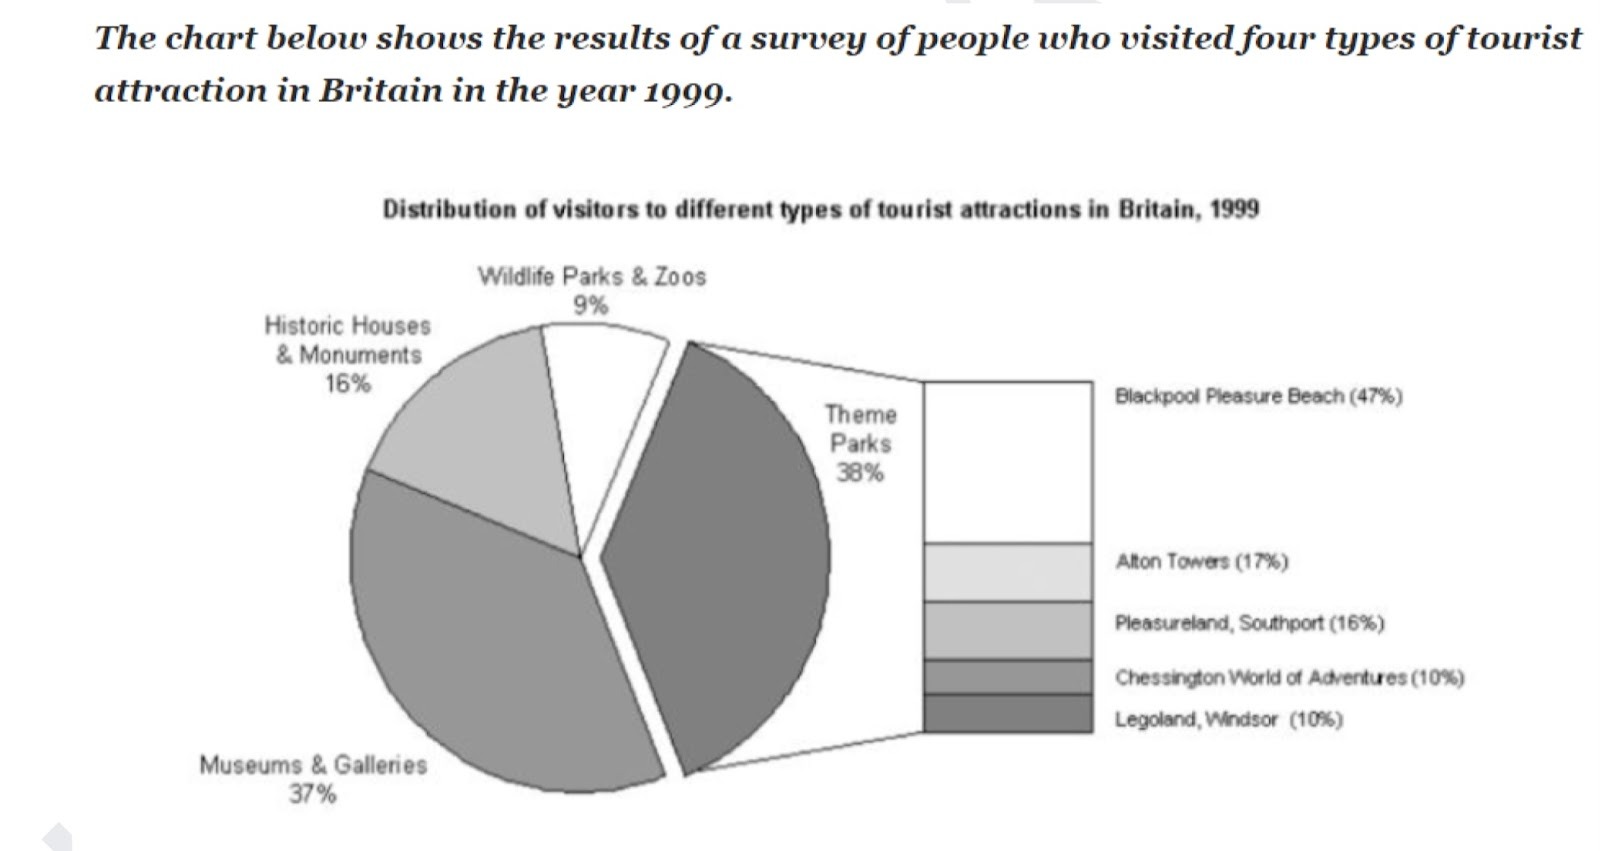
[Pie Chart] Distribution of tourist to attractions in UK
The provided chart illustrates how visitors to an array of British tourist destinations were distributed in 1999. Overall, theme parks ...