
[Bar Graph] Different occupations who moved to Australia
The chart below gives information on the numbers of workers in different occupations who migrated to Australia between 2009 and 2012
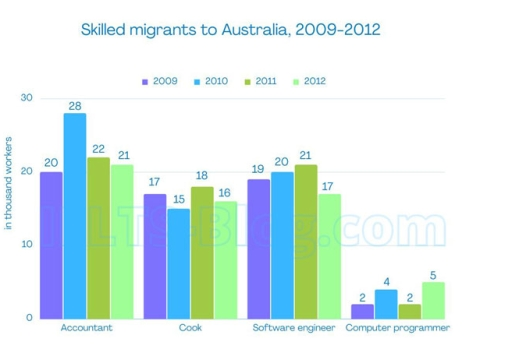
The provided bar graph compares the number of skilled laborers across four different disciplines who moved to Australia between 2009 and 2012.
Overall, the number of accountants who migrated to Australia for employment was the highest across the board. In addition, with the exception of computer programmers, the remaining types of workers entering Australia saw net decreases over the period.
In 2009, 20,000 accountants chose to move to Australia for work. This figure was followed closely by those for cooks and software engineers, at a comparable 17,000 and 19,000, respectively. Computer programmers, on the other hand, had a substantially lower figure, numbering only 2000 individuals.
In the following year, the number of accountants migrating grew by 8,000 and the figure for computer programmers witnessed a twofold increase. Having peaked at 28,000 in 2010, the number of accountants who migrated subsequently fell to just 21,000 in 2012. Meanwhile, despite also plummeting close to its original value, only among computer programmers was there a rebound to almost 5,000 workers in the final year.
The number of cooks and software engineers who chose Australia as a migration destination also experienced overall slumps over the 3-year period. However, while the figures for culinary workers saw slight fluctuations between 2,000 and 3,000 individuals each year, the number of software engineers peaked at 21,000 before registering a 4,000-drop in the final year.
Responses