
[Bar Graph] The bar graph shows the global sales (in billions of dollars) of different types of digital games
The bar graph shows the global sales (in billions of dollars) of different types of digital games
between 2000 and 2006.
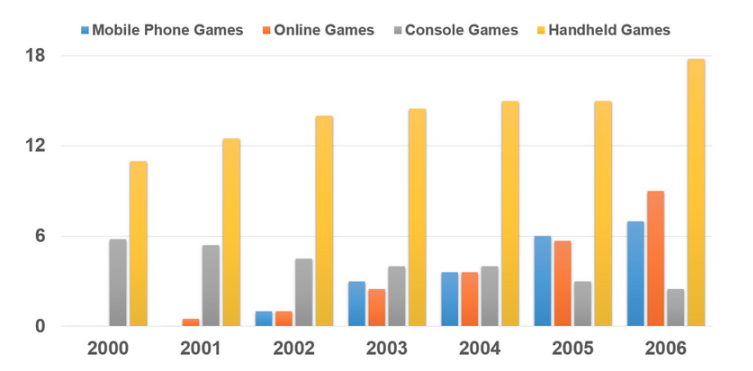
The bar chart illustrates the turnover in dollars generated from the sales of video games across four distinct platforms—mobile phones, online, consoles, and handheld devices—spanning from 2000 to 2006. Overall, sales for three of the platforms experienced consistent growth annually, contributing to a substantial increase in total global turnover over the seven-year period. Notably, sales figures for handheld games consistently outpaced those of other platforms by a significant margin in almost every year.
In 2000, worldwide sales of handheld games amounted to approximately $11 billion, while console games earned just under $6 billion. However, no specific figures were provided for mobile or online games in that year. Over the subsequent three years, sales of handheld video games surged by approximately $4 billion, whereas the figure for console games witnessed a decline of $2 billion. Concurrently, the popularity of mobile phone and online games began to emerge, with sales reaching around $3 billion by 2003.
By 2006, sales of handheld, online, and mobile games reached their peak at $17 billion, $9 billion, and $7 billion, respectively. In contrast, turnover from console games plummeted to its lowest point, hovering around $2.5 billion.
191 Words – Band 8.0

Responses