
[Mixed Charts] The bar chart below shows the proportions of English men and women of different ages who were living alone in 2011
The bar chart below shows the proportions of English men and women of different ages who were living alone in 2011. The pie chart compares the numbers of bedrooms in these one-person households.
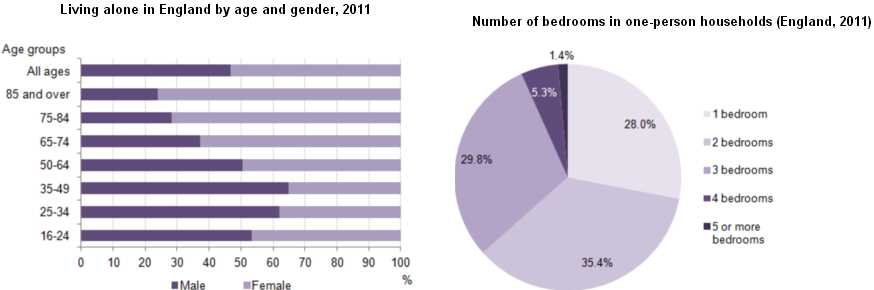
The two charts present data on single-occupant households in England for the year 2011. The bar chart compares the distribution of occupants’ age and gender, while the pie chart illustrates the prevalence of various bedroom numbers in these residences.
Overall, females constituted a higher proportion of individuals living alone compared to males, with this contrast particularly pronounced in older age groups. Furthermore, it is notable that the most common number of bedrooms in single-occupant homes was two.
Among individuals aged 65 and over residing alone in England in 2011, a significant majority were female. Women represented approximately 72% of single occupants aged 75 to 84 and 76% of those aged 85 or over. Conversely, among younger adults, male representation was higher. For instance, in the 35-49 age category, men accounted for nearly 65% of people living alone.
Regarding the number of bedrooms in single-occupant homes, 35.4% were found to have two bedrooms, while one-bedroom and three-bedroom residences comprised 28% and 29.8% of the total, respectively. Additionally, less than 7% of single-occupant homes featured four or more bedrooms.
179 Words – Band 8.0
Responses