
[Pie Chart] The pie charts below compare water usage in San Diego, California and the rest of the world.
The pie charts below compare water usage in San Diego, California and the rest of the world.
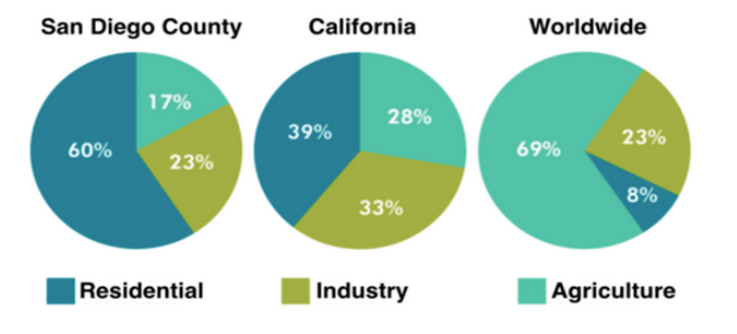
The provided pie charts illustrate how different regions distribute their water for residential, industrial and agricultural use compared to the rest of the world.
Overall, while San Diego County appears to allocate most of its water for residential purposes, most of the water worldwide is reserved for agriculture. In comparison, California’s water distribution is the most even of the three.
Household water use dominates the figures surveyed in both San Diego County and California. The most notable difference is that while the former distributed a staggering 60% of its water for homes, that of the latter only comes to 39%. In contrast, the rest of the world used just 8% of its water for this purpose.
While water distribution for the industrial sector is fairly even across the board, the world allocates its water most heavily for agriculture compared to the surveyed regions. In San Diego County, industry comprises 23% of all water used, aligning with the rest of the world, while the figure for California is evidently higher at 33%. For agriculture, the rest of the world records a markedly higher proportion at 69%, while California’s figure is less than half of that, and San Diego County’s data is even lower, at just 17%.

Responses