
[Bar Graph] The charts below show the levels of participation in education and science in developing and industrialised countries in 1980 and 1990.
The charts below show the levels of participation in education and science in developing and industrialised countries in 1980 and 1990.
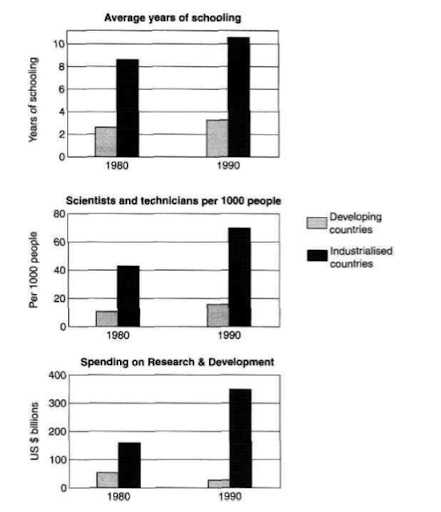
The three bar charts depict average years of schooling, the quantity of scientists and technicians, and research and development expenditure in both developing and developed countries for the years 1980 and 1990. Overall, developed nations exhibit significantly higher figures across all metrics compared to their developing counterparts. Moreover, there is a noticeable overall increase in educational participation and scientific engagement from 1980 to 1990.
In developing nations, individuals attended school for an average of approximately 3 years, with only a marginal increase in years of schooling observed from 1980 to 1990. Conversely, industrialized countries experienced a substantial rise from nearly 9 years of schooling in 1980 to almost 11 years in 1990.
During the same period, the number of scientists and technicians in industrialized nations nearly doubled, reaching around 70 per 1000 people. Research and development spending also underwent rapid expansion in these countries, soaring to $350 billion in 1990. In contrast, the number of science professionals in developing countries remained below 20 per 1000 people, while research spending declined from about $50 billion to a mere $25 billion.


Responses