
[Bar Graph] The charts below compare the age structure of the population of France and India in 1984
The charts below compare the age structure of the population of France and India in 1984.
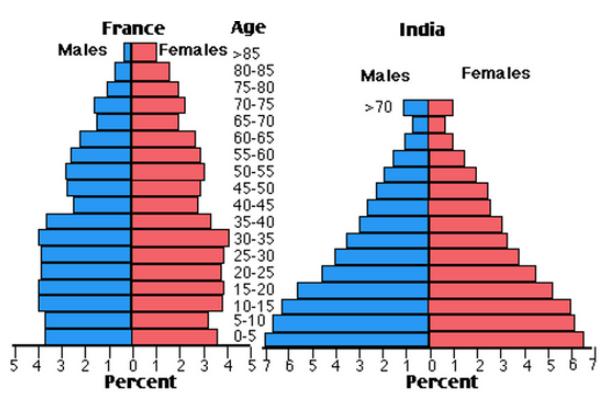
The two charts provide a comparative analysis of age distribution by gender for the populations of France and India in the year 1984.
Overall, India had a younger population compared to France during this period. Conversely, France exhibited a notably higher percentage of elderly individuals.
In India, nearly 14% of the population belonged to the age group of 5 years or younger, with subsequent age brackets demonstrating a declining proportion of the population. In contrast, France displayed a more uniform distribution across age ranges, with consistent figures (around 7% to 8%) for each five-year cohort up to the age of 40. The elderly population (aged 70 and above) constituted approximately 10% to 15% of the total population in France, whereas in India, this figure was only 2%.
Regarding gender distribution, the proportion of women in Frant above the age of 50 was significantly higher than that of men. For instance, almost 3% of French individuals aged 70 to 75 were women, while the corresponding figure for men was just under 2%. Conversely, no significant gender disparities were evident in the age distribution of the Indian population depicted in the charts.


Responses