
[Bar Graph] The chart below shows numbers of incidents and injuries per 100 million passenger miles travelled (PMT) by transportation type in 2002
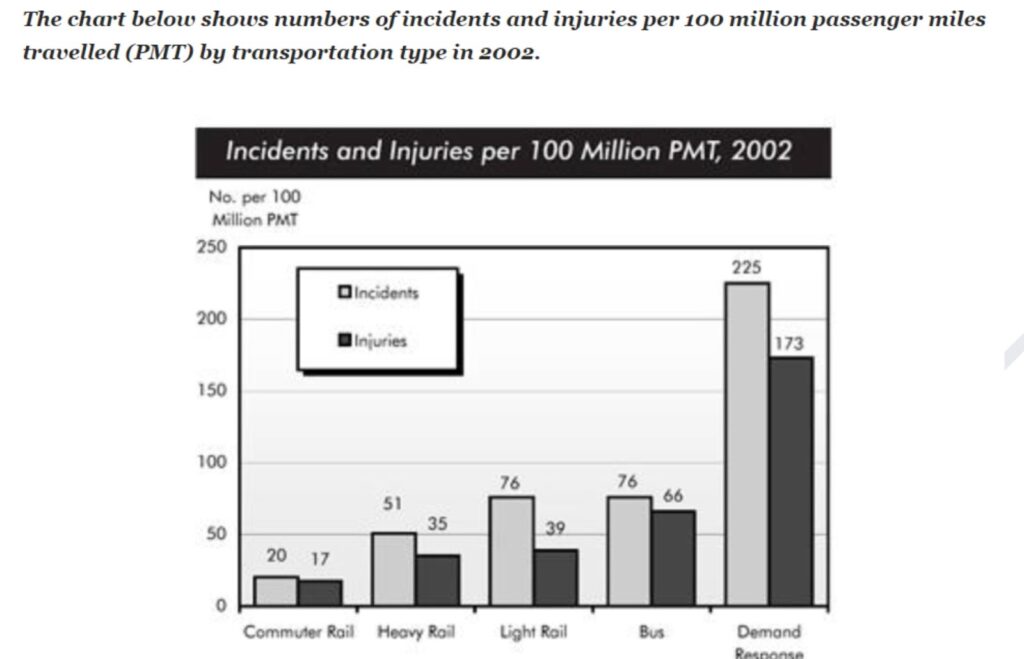
The chart below shows numbers of incidents and injuries per 100 million passenger miles travelled (PMT) by transportation type in 2002.
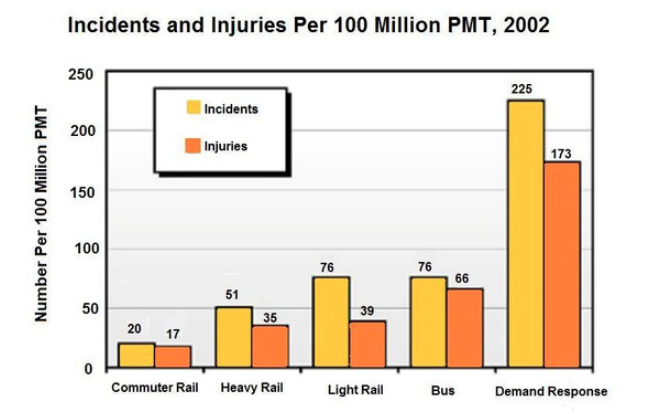
The bar chart provides a comparison of the frequency of incidents and injuries per 100 million passenger miles traveled across five distinct types of public transportation in 2002. It is evident that demand-response vehicles witnessed the highest number of incidents and injuries, while commuter rail services recorded notably lower figures.
Demand-response transport services reported a total of 225 incidents and 173 injuries per 100 million passenger miles traveled, making them nearly three times higher than the second-highest category, bus services. Bus services, in comparison, recorded 76 incidents and 66 injuries.
Rail services displayed a varying degree of incidents and injuries. Light rail trains reported a number of incidents equal to buses, but with significantly fewer injuries, totaling only 39. On the other hand, heavy rail services experienced lower incident rates compared to light rail, and commuter rail services exhibited the lowest incidence of problems. Specifically, only 20 incidents and 17 injuries were reported on commuter trains, signifying a notably safer mode of transportation.


Responses