
[Mixed Charts] The graph and table below give information about water use worldwide and water consumption in two different countries
The graph and table below give information about water use worldwide and water consumption in two different countries.
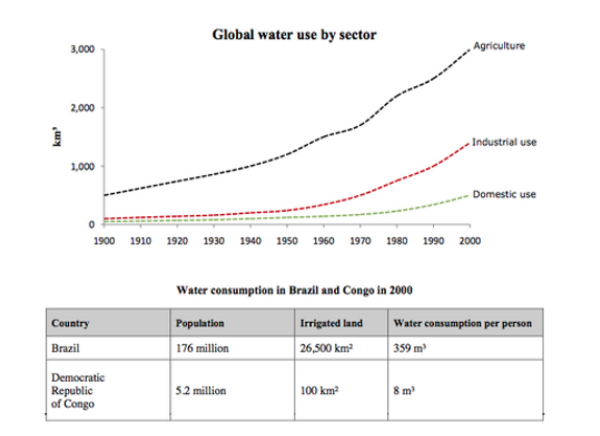
The charts provide a comparison of water usage for agriculture, industry, and residential purposes globally, as well as specifically in Brazil and the Democratic Republic of Congo.
Overall, global water demands experienced a significant increase from 1900 to 2000, with agriculture constituting the largest share of water usage. Furthermore, water consumption in Brazil surpassed that of the Congo by a considerable margin.
In 1900, agricultural water usage worldwide amounted to around 500km³. Industrial and residential water consumption accounted for approximately one fifth of that volume. However, by the year 2000, global agricultural water usage had surged to approximately 3000km³, with industrial water consumption nearly half of that amount, and residential usage reaching approximately 500km³.
In 2000, Brazil’s population was 176 million, whereas the Democratic Republic of Congo had a population of 5.2 million. Water consumption per capita in Brazil was significantly higher at 359m³ compared to only 8m³ in the Congo. This discrepancy could be attributed to the fact that Brazil possessed 265 times more irrigated land than the Congo, thus requiring greater water resources for agricultural purposes.
179 Words – Band 8.0


Responses