
[Line Graph] World Food and Oil Prices Line Graph
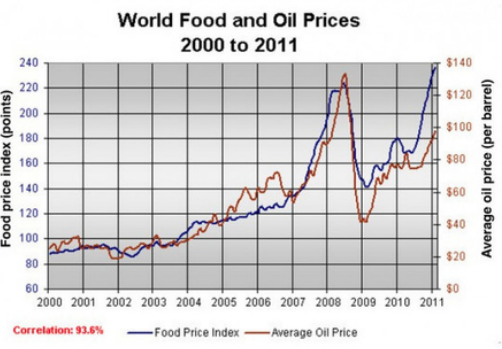
The graph below shows changes in global food and oil prices between 2000 and 2011.
Plan:
- Bài này chỉ có 2 đối tượng, song lại có rất nhiều thông tin, vì vậy để miêu tả đầy đủ các thông tin này thì ta nên chia ra nhiều khoảng thời gian khác nhau. Đầu tiên sẽ là 2000 – 2004, 2004 đến 2007, 2007 đến 2008, 2009 và 2011.
- Điểm đặc biệt khác chính là 2 chỉ số này không cùng đơn vị, với đơn vị của dầu mỏ ở bên phải (màu đỏ), và của thực phẩm bên trái (màu xanh). Đồng thời ta cũng nên nhắc đến correlation (tức là sự giống nhau) ở phần overview.
Structure:
- Body 1: Chúng ta sẽ miêu tả 2 khoảng thời gian đầu cho body 1 – bắt đầu bằng việc liệt kê và so sánh các đối tượng ở năm đầu, 2000. Sau đó chúng ta thấy 2 đường này dường như không thay đổi trong 4 năm kế tiếp. Từ 2004 đến 2007 thì chỉ số của chúng tăng.
- Body 2: Từ 2007 đến 2008 thì cả 2 chỉ số tăng vọt, và dầu mỏ đạt đỉnh. Tuy nhiên chỉ một năm sau đó thì chúng giảm mạnh, và cuối cùng ở năm 2011 thì cả 2 lại tăng lên. Ở năm cuối cùng thì thức ăn chạm mốc cao nhất.
The provided line graph compares the differences between the average price of a barrel of oil and the food price index over an 11-year period. It is evident that both the average global prices of oil and food experienced significant increases between 2000 and 2011. Moreover, the trends for both commodities exhibited remarkable similarity, suggesting a strong correlation.
In the first 4 years, the average global oil price remained relatively stable around $25 per barrel, while the food price index was just below 90 points. By 2007, the average oil price had more than doubled, reaching nearly $60 per barrel, and food prices had risen by approximately 50 points.
A notable surge in both commodity prices occurred from 2007 to 2008, with oil prices peaking at approximately $130 per barrel, and the food price index reaching 220 points. However, by the beginning of 2009, the price of oil had dropped by around $90, and the food price index had decreased by about 80 points. Finally, in 2011, the average oil price experienced another increase, reaching nearly $100 per barrel, while the food price index reached its pinnacle at almost 240 points.


Responses