
[Line Graph] Visits to a community website
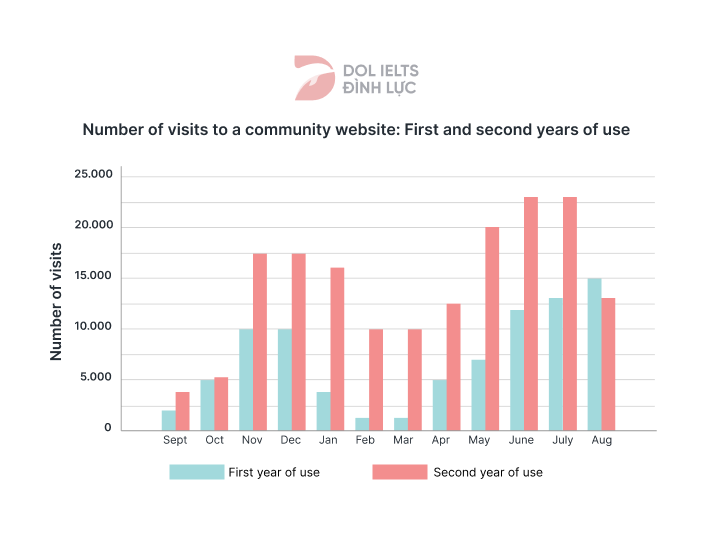
The provided bar graph illustrates the number of visits to a community website during its first and second years of operation.
It is clear that the website attracted significantly more visitors in its second year, with June and July recording the highest figures overall.
In September of the first year, the website received approximately 2,500 visits, which increased to over 4,000 a year later. Following this, traffic levels generally rose towards November and December, reaching 10,000 visits for the first year and 15,000 for the second each month, before experiencing a sharp decline in February and March. During these two months, visits never surpassed 2,000 in the first year, whereas they remained at around 10,000 in the second.
From April onwards, the number of visits rebounded and continued to climb, achieving new highs in both years. Only in August did the first-year figure exceed that of the second, peaking at around 15,000 visits. Meanwhile, June and July saw record traffic in the second year, with over 20,000 visits each month — representing a twofold increase compared to the same period the year before.


Responses