
[Pie Chart] Pie Chart Hotel Service ratings
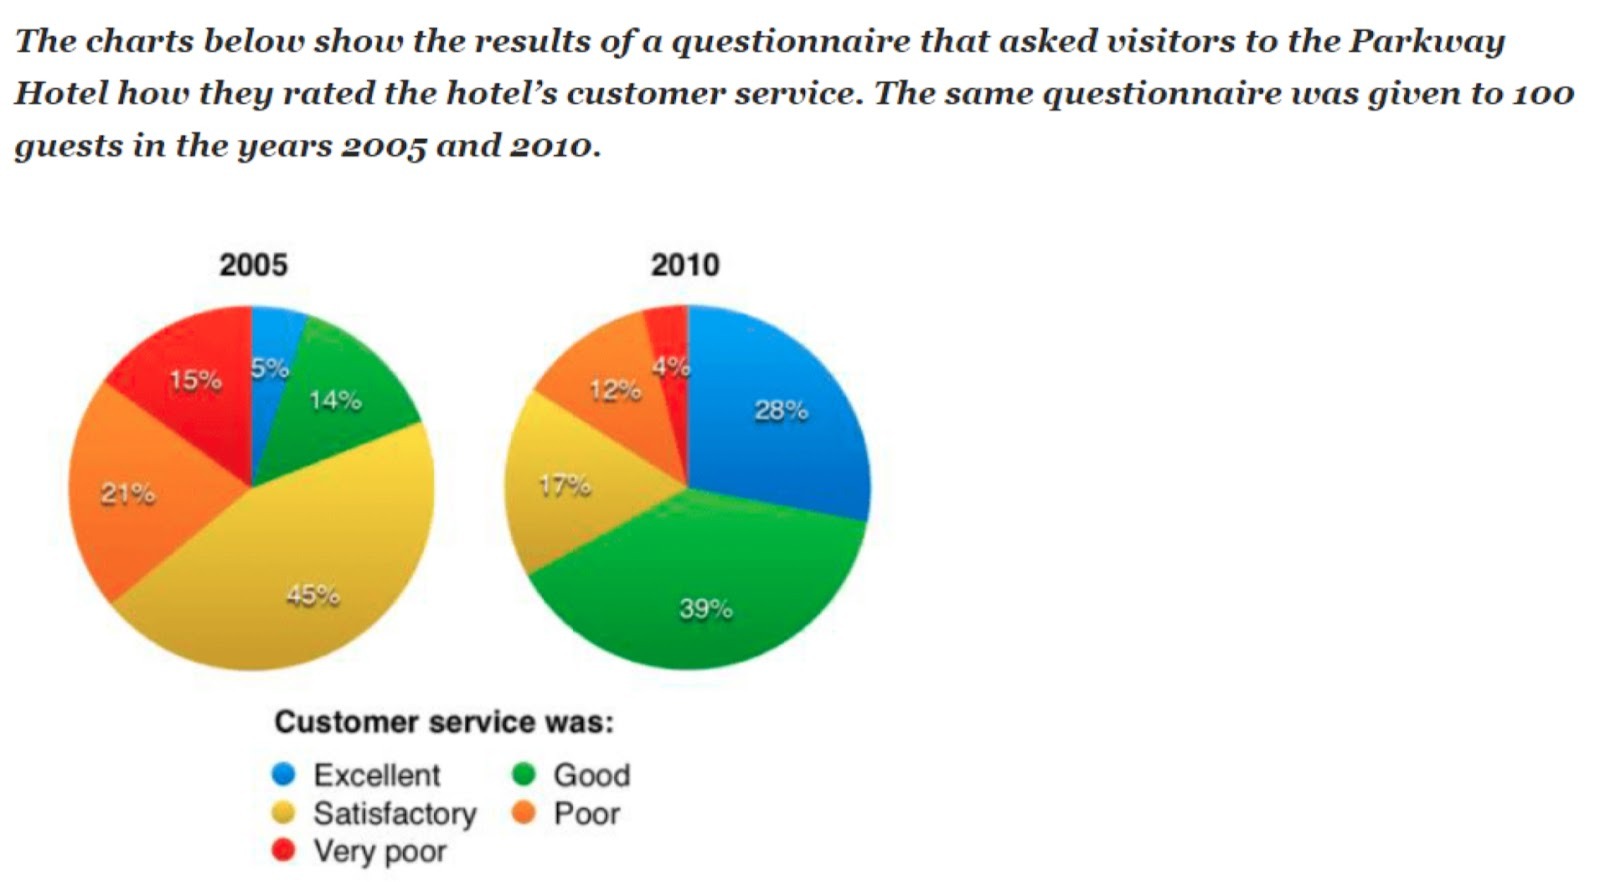
The provided pie chart compares ratings of patrons to a hotel based on its customer service over a 5-year period. Overall, while the majority of the feedback were satisfactory in 2005, the hotel saw an influx of good and excellent reviews in 2010.
In 2005, 45% of all ratings were satisfactory, while poor ratings were half of that. In comparison, the proportion of visitors who deemed the service good and very poor were comparable at 14% and 15%, respectively. Finally, excellent reviews were the rarest taking up only 5%.
5 years later, drastic changes to the results were witnessed, as the hotel customer service was being rated more positively. Of this, good and excellent ratings took the lead, at 39% and 29% accordingly. Meanwhile, the portion of satisfactory feedback dropped by 3 times, and that of poor reviews were halved. Finally, at the bottom of the list were very poor ratings, which declined to just 4%.


Responses