
[Table] – Difficulty hiring table (07/08/23)
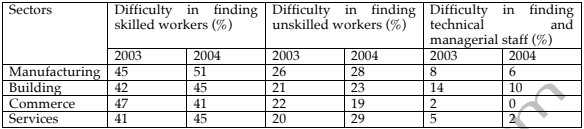
The table below shows the percentage of employers in various sectors having difficulty in finding staff in 2003 and 2004.
Plan:
Trong bài này ta có 2 cách viết:
- Cách đầu là viết theo thời gian, tức là so sánh các ngành với nhau dựa theo thời gian. Để viết cách này thì sẽ hơi khó, vì có quá nhiều thông số.
- Vì vậy, ta có thể chia bài này thành các loại nhân viên, tức là skilled workers trước, rồi đến unskilled và managers.
Khi chia theo cách sau thì ta thấy sẽ dễ quản lý hơn:
- Skilled workers khó tìm nhất trong 3 loại workers, trong số này thì commerce đứng đầu năm 2003, nhưng lại đi xuống và nhường ngôi cho manufacturing. Ngoài ra ở các ngành còn lại thì đều hơn 40%.
- Đến unskilled thì con số này nhỏ hơn, có thể nói nhỏ hơn gần gấp đôi, nhưng về cụ thể thì cũng thấy trend tương tự, vì commerce vẫn là nơi có số giảm, các cái còn lại tăng. Trong đoạn này các bạn có thể chọn những số liệu cụ thể về độ tăng giảm, vì sẽ gộp được manufacturing với building (cùng tăng 2%), trong khi services tăng nhiều nhất (9%) và commerce là cái duy nhất giảm (3%)
- Cuối cùng với managers thì ta thấy các vị trí này khá dễ tìm, vì các cty đều dưới 15%, trong đó building là cao nhất.
Từ vựng:
- Ngoài ra điểm khó của bài này nằm ở phần từ vựng, đặc biệt là cách diễn đạt – ví dụ đề bài nói về bộ phận các công ty gặp khó khăn trong việc tuyển người -> vì vậy ta paraphrase phải cẩn thận – như là 40% các cty thuộc ngành tài chính cảm thấy khó tuyển nhân viên (40% of companies in finance found it hard to hire staff) và tất nhiên ta có thể dùng các cụm như là this data/figure/statistic, hay that of … (manufacturing/commerce/service) để viết lại.
The table illustrates the proportion of businesses in 4 sectors that faced challenges when seeking employees over a 2-year period. Overal, it was harder to find skilled workers in all listed industries. Furthermore, it was typically easier to fill managerial and technical positions in 2004 than it was a year before.
For skilled laborers, more than 40% of all businesses in both years had trouble hiring employees. For 2003, employers in commerce topped the chart as 47% of these businesses had difficulty hiring. A year later, however, it was easier for them to find skilled workers, yet the opposite trend was witnessed for all other sectors, particularly manufacturing where more than half struggled to hire.
Similarly, the statistics for manufacturers and builders both rose by 2% while commerce was the only one that observed a 3% drop. Services, however, found it much harder to fill out unskilled positions, as it witnessed the most significant rise of 9% over the period. In comparison, less than 15% of all businesses had trouble finding managers and technical staff initially, and it was less challenging in 2004. Despite this, the building industry struggled the most when searching for these positions.
196 Words – Band 8.0


Responses