
[Table] – Waste Production Table
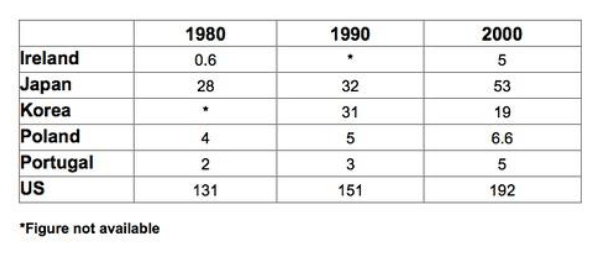
The table below shows the amount of waste production (in millions of tonnes) in six different countries over a twenty-year period.
Plan:
Có 2 cách viết bài này:
Cách đầu là viết theo thời gian, và cũng là cách dễ viết hơn nên bạn nào không có nhiều thời gian hay không phân tích bài nhanh thì có thể chọn cách này. Về cách này ta sẽ viết số liệu của các quốc gia ở 1980 trong đoạn 1 và sự thay đổi của chúng cũng như số liệu của năm 2000 trong đoạn 2.
Tuy nhiên bài mẫu dưới đây được viết theo cách 2 – tức là phương pháp gộp. Để viết cách này các bạn phải tìm những đối tượng tương đồng hay đối nghịch để so sánh. Cụ thể trong đoạn 1 ta thấy US, Japan, Poland và Portugal được gộp chung. Chúng có điểm chung là đều tăng sau 20 năm. Cụ thể hơn thì US là nước tạo nhiều chất thải nhất, kế đến là Japan và 2 quốc gia còn lại.
Cuối cùng qua đoạn 2 người viết đã chọn gộp Korea và Ireland – cụ thể là vì Korea là nước có thông số giảm, còn Ireland lại là nước tăng nhiều nhất. Vì vậy 2 quốc gia này khá tương phản.
The chart compares the amounts of waste that were produced in six countries in the years 1980, 1990 and 2000. In each of these years, the US produced more waste than Ireland, Japan, Korea, Poland and Portugal combined. It is also noticeable that Korea was the only country that managed to reduce its waste output by the year 2000.
Between 1980 and 2000, waste production in the US rose from 131 to 192 million tonnes, and rising trends were also seen in Japan, Poland and Portugal. Japan’s waste output increased from 28 to 53 million tonnes, while Poland and Portugal saw waste totals increase from 4 to 6.6 and from 2 to 5 million tonnes respectively.
The trends for Ireland and Korea were noticeably different from those described above. In Ireland, waste production increased more than eightfold, from only 0.6 million tonnes in 1980 to 5 million tonnes in 2000. Korea, by contrast, cut its waste output by 12 million tonnes between 1990 and 2000.
167 Words – Band 9.0
Written by Examiner

Responses