
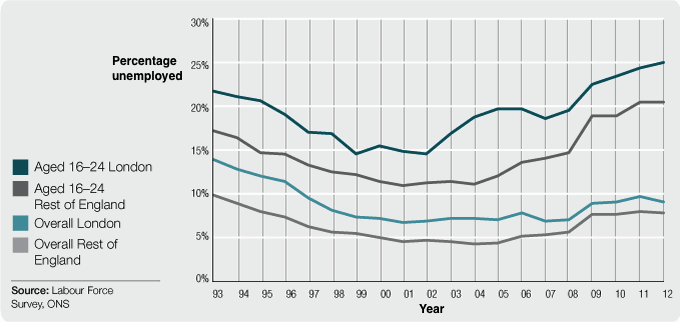
[Line Graph] WT1 Adult Employment Rates Line Graph
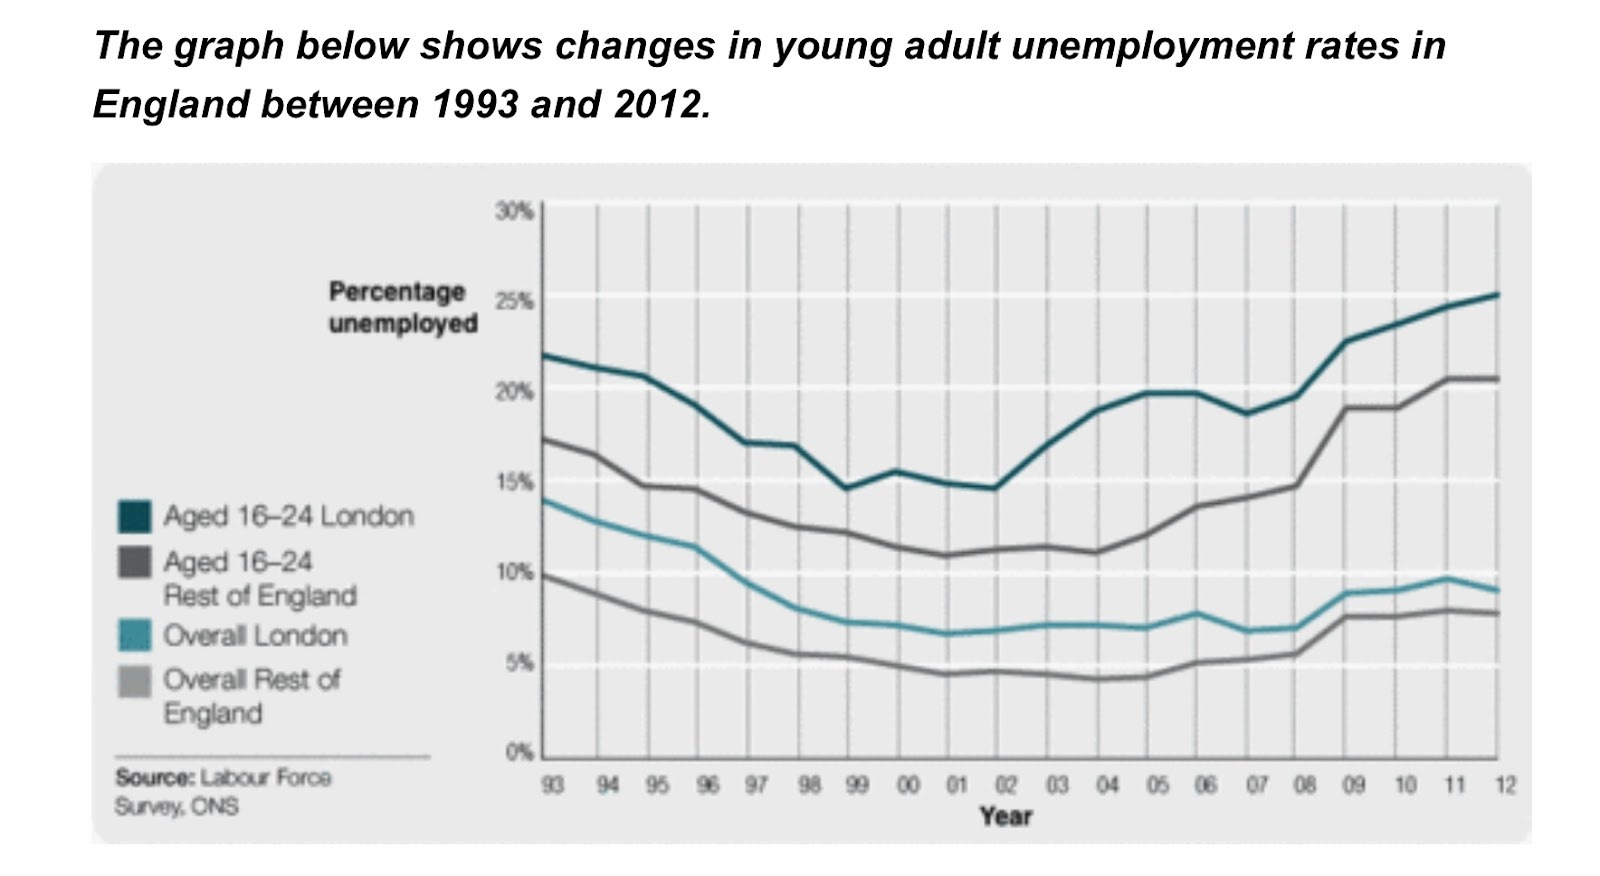
The line graph compares the proportion of unemployed young adults in England over a period of 19 years. Overall, London generally witnessed a higher rate of unemployment compared to the rest of England. Furthermore, those aged 16-24 were more likely to be without work than other groups.
In 1993, unemployment was the highest for Londoners between 16 to 24, at roughly 22%. This was followed by the same age group in the rest of England, where the rate was 5% less. In comparison, nearly 15% of all London inhabitants were jobless, as opposed to just under 10% for the rest of the country.
Over the 19-year-period, the rate of joblessness for young Londoners first witnessed a drop before bouncing back after 2002, reaching a new high of around 25% in the end. A similar trend was observed among the same age group for the rest of the country, yet its changes were much milder, climbing to just over 20%. In contrast, unemployment rates among the overall population in both London and the rest of the country first decreased, then leveled out and stayed under 10% in 2012.
187 Words – Band 8.0

Responses