Shopping Cart

    No products in the cart.

    Sign in Sign up
    Ielts Logic
    Ielts Logic

    Category: Mixed Chart

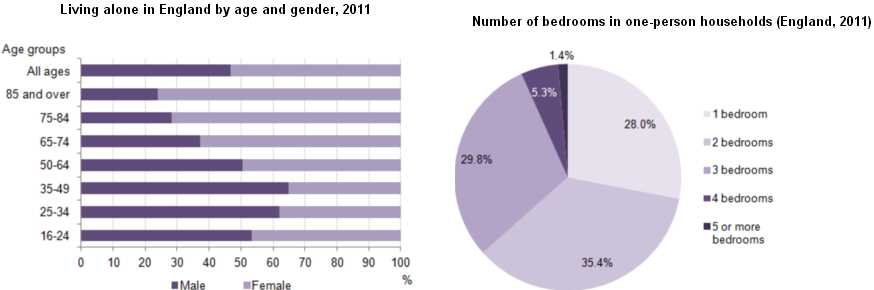
    [Mixed Charts] The bar chart below shows the proportions of English men and women of different ages who were living alone in 2011

    The bar chart below shows the proportions of English men and women of different ages who were living alone in 2011. The pie chart compares…

    congtam1997
    congtam1997 November 10, 2025
    0 Comments

    [Mixed Charts] The charts below show reasons for travel and the main issues for the travelling public in the US in 2009

    The charts below show reasons for travel and the main issues for the travelling public in the US in 2009. The bar chart and pie…

    congtam1997
    congtam1997 November 10, 2025
    0 Comments

    [Mixed Charts] The charts show average levels of participation in education and the highest education level of adults from 2000 to 2010 in Singapore

    The charts show average levels of participation in education and the highest education level of adults from 2000 to 2010 in Singapore. While the bar…

    congtam1997
    congtam1997 November 10, 2025
    0 Comments

    [Mixed Charts] The climograph below shows average monthly temperatures and rainfall in the city of Kolkata

    The climograph below shows average monthly temperatures and rainfall in the city of Kolkata. The chart provides a comparison of average temperature and precipitation figures…

    congtam1997
    congtam1997 November 10, 2025
    0 Comments

    [Mixed Charts] The graph and table below give information about water use worldwide and water consumption in two different countries

    The graph and table below give information about water use worldwide and water consumption in two different countries. The charts provide a comparison of water…

    congtam1997
    congtam1997 November 10, 2025
    0 Comments

    Recent Posts

    • [Problem and Solution] Ways humans are damaging environment
    • [Problem and Solution] Household Waste
    • [Problem and Solution] Rising public transportation cost
    • [Problem and Solution] Increasing life expectancy
    • [Problem and Solution] Reducing food waste

    Recent Comments

    No comments to show.

    Archives

    • November 2025
    • October 2025
    • April 2024
    • September 2023

    Categories

    • Bar Graph
    • Blog
    • Discussion
    • Line Graph
    • Maps
    • Mixed Chart
    • Opinion
    • Pie Chart
    • Positive and Negative
    • Problems and Solutions
    • Process
    • Speaking Part 2 Sample
    • Table
    • Two-part Question
    • Writing Task 2

    Recent Posts

    • [Problem and Solution] Ways humans are damaging environment
    • [Problem and Solution] Household Waste
    • [Problem and Solution] Rising public transportation cost
    • [Problem and Solution] Increasing life expectancy
    • [Problem and Solution] Reducing food waste

    Categories

    • Bar Graph
    • Blog
    • Discussion
    • Line Graph
    • Maps
    • Mixed Chart
    • Opinion
    • Pie Chart
    • Positive and Negative
    • Problems and Solutions
    • Process
    • Speaking Part 2 Sample
    • Table
    • Two-part Question
    • Writing Task 2
    © 2026 - IELTS Logic