
[Mixed Charts] The charts show average levels of participation in education and the highest education level of adults from 2000 to 2010 in Singapore
The charts show average levels of participation in education and the highest education level of adults from 2000 to 2010 in Singapore.
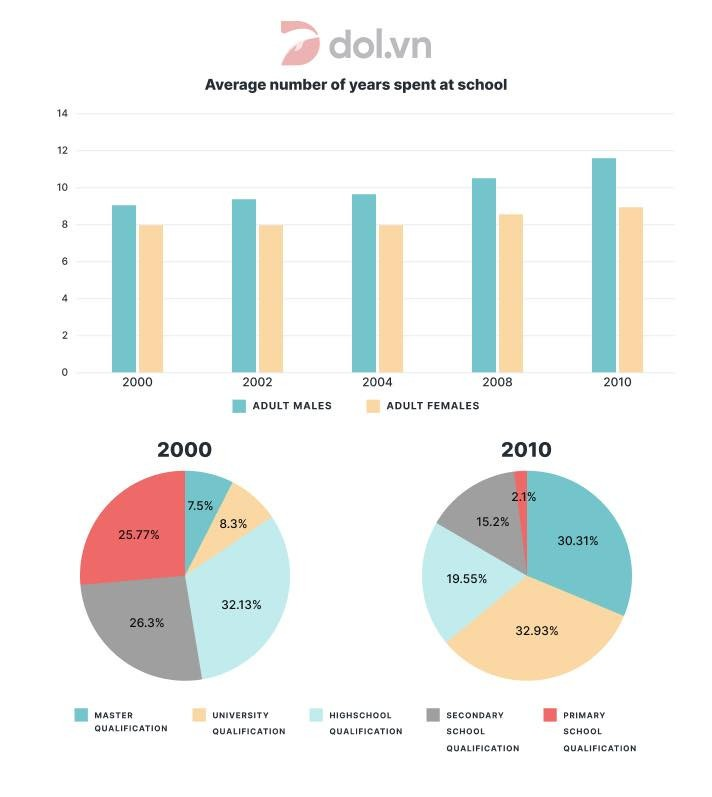
While the bar chart compares the length of education for males and females in Singapore between 2000 and 2010, the pie charts depict the level of education in the same country and period. Overall, it should be noted that men often spent more time at school than women. Furthermore, the proportion of university and masters qualifications increased exponentially after a decade.
In details, men typically spent over 8 years in formal education in 2000. However, this number rose steadily and after 10 years, it rose to just under 12 years. For women, it remained at exactly 8 years from 2000 to 2004. After this period, though, the number of years that Singaporean women spent studying began to rise gradually. Despite this, it never exceeded or came close to that of men in any year.
When it comes to qualifications, it should be noted that in 2000, most Singaporeans had a highschool degree (32.13%), followed by a secondary and primary qualification (roughly a quarter each). Because of that, only 15% of the population university education or higher at the time. A decade later, however, a complete shift in the education level was witnessed, as more than 60% of citizens either have a university or masters qualification. Meanwhile, less than 20% stopped at highschool and secondary level while only a tenth of that ended up with a primary education.


Responses