
[Line Graph] British Unemployment Rates Line graph
The graph below shows changes in young adult unemployment rates in England between 1993 and 2012.
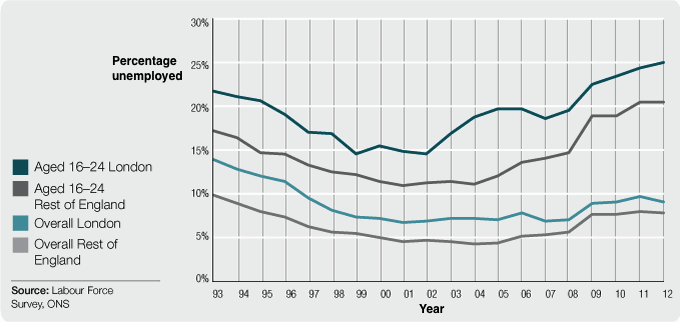
The provided line graph compares the percentage of unemployed young adults with the overall rate of joblessness both in London and the rest of England.
Overall, unemployment was generally higher for London than the rest of the country, regardless of demographic. However, those aged 16-24 appeared to be affected by joblessness the most.
In 1993, approximately 22% of those between 16 and 24 years old were without work in London, compared to the overall unemployment rate of just under 15% of the region. The rest of the country did a better job tackling joblessness, as was exemplified by the overall rate of just 10%, yet nearly 15% of youths across England aged between 16 to 24 struggled with this.
Between 1993 and 2002, this rate observed net decreases of approximately 7% across the board, with the exception of the country’s overall figure, which only dropped by 5%. Over the remaining period, the percentage of jobless Londoners and British citizens in general remained relatively stable with the exception of slight increases after 2008, but these never rose above 10%. The same could not be said for English youths, however, as joblessness climbed noticeably and overtook their 1993 levels, peaking at 25% for Londoners, and just over 20% for the rest of the country in 2012.


Responses